NASDAQ Correction: Is This the Buy Signal Everyone Ignores?
⚠️ Investment Disclaimer: This article is for informational purposes only. Nothing here constitutes financial or investment advice. All investment decisions carry risk, and past performance does not guarantee future results.
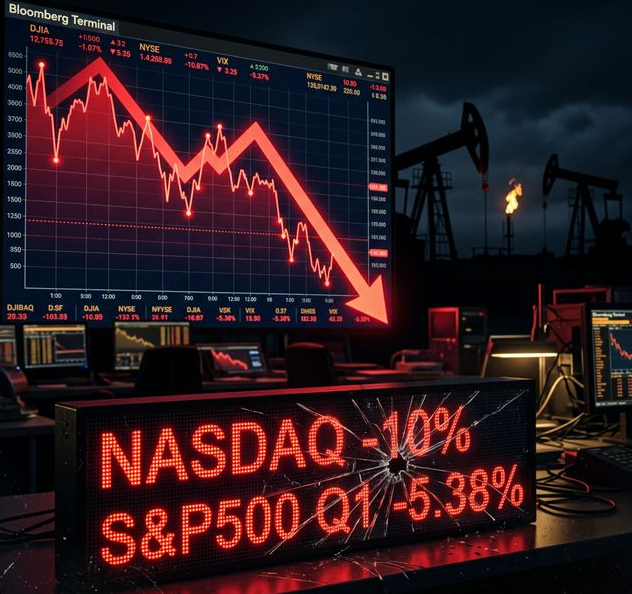
Warren Buffett once said: “Be fearful when others are greedy, and greedy when others are fearful.” In March 2026, fear is everywhere. The NASDAQ has officially entered correction territory. The S&P500 closed Q1 down 5.38% — its worst first quarter in years. Three forces drove this selloff: the US-Iran war, a violent oil price spike, and a sudden reversal in Fed rate expectations. So is this the moment to buy, or is worse coming? The data tells an interesting story.
📉 The NASDAQ Correction: What the Numbers Actually Say
🔢 Defining the Correction and Where We Stand
A market correction means a drop of 10% or more from a recent peak. The NASDAQ Composite crossed that threshold on March 27, 2026. It fell 1.4% that day alone. The previous session saw a 2.38% single-day drop. That is five consecutive weeks of losses — the longest weekly losing streak in nearly four years.
The Dow Jones Industrial Average briefly touched correction territory too, falling over 400 points in a single session. For the month of March, the Dow finished down 3.7%. Big Tech was the biggest drag. Amazon, Meta, Tesla, and Oracle all posted heavy losses.
📊 The S&P500 Q1 Report Card
The S&P500 lost 5.38% in Q1 2026. The index now sits at 6,383 points, down 7.24% over the past month. At the start of the year, rate cut expectations kept markets optimistic. That optimism has completely collapsed. The same index that was climbing in January is now fighting to hold key support levels.
This is not a minor pullback. It is a broad repricing of risk across all sectors — driven by real-world macro shocks that were not part of anyone’s 2026 forecast.
🌍 Three Reasons the Market Is Breaking Down
🛢️ The Iran War and the Oil Price Shock
Before the US-Iran conflict began, Brent crude traded near $70 per barrel. Today it sits at $110 per barrel. WTI crude hit $98.59. That is a 57% surge in a matter of weeks. Analysts at Macquarie warned that if the conflict continues through June, oil could reach $200 per barrel. That would be an economic catastrophe for energy-intensive industries.
President Trump announced a pause on Iranian energy strikes. But markets did not rally. Investors see no clear path to de-escalation. Until there is a credible ceasefire deal, energy prices will stay volatile — and that feeds directly into inflation.
📈 Inflation Is Making a Comeback
Higher oil prices mean higher everything prices. US consumer sentiment fell to its lowest level since December 2025. Inflation expectations for 2026 jumped to 3.8% — the largest one-month increase in over a year. The OECD raised its US inflation forecast to 4.2% for the full year. That is more than double the Federal Reserve’s 2% target.
Energy costs ripple through the entire economy. Shipping, manufacturing, food production — all take a hit when oil spikes. Companies raise prices to protect margins, and consumers absorb the pain. Confidence falls. Spending slows.
🏦 The Fed Rate Hike Reversal
This is perhaps the most significant shift. At the start of 2026, markets were pricing in multiple rate cuts. That narrative is dead. The probability of a Fed rate hike by year-end has crossed 50% for the first time this cycle. Bond yields are rising. Borrowing costs are climbing across the economy.
For growth stocks — especially Big Tech — rising rates are toxic. When the discount rate goes up, future cash flows are worth less today. That is why the NASDAQ is falling harder than the Dow. The math punishes high-multiple growth companies more than value stocks or dividend payers.
📚 What History Says About Q1 Losses and What Comes Next
🔄 The Pattern After a Weak First Quarter
History shows that a bad Q1 does not always predict a bad year. Multiple times in market history, a rough Q1 was followed by strong Q2-Q4 recoveries. This happened after geopolitical shocks, inflation scares, and rate uncertainty — all of which describe the current environment perfectly.
Baron Rothschild famously said: “Buy when there’s blood in the streets.” The logic is simple. Panic selling creates mispricing. Fundamentally strong companies get dragged down with the weak ones. Patient buyers who step in during the panic often come out ahead.
But history is a guide, not a guarantee. Every correction has a unique cause, and this one is driven by real, ongoing geopolitical conflict. The recovery depends on when — and whether — the conflict de-escalates.
🤖 AI Infrastructure: The Structural Bull Case
Despite the selloff, AI infrastructure spending continues to accelerate. Data center demand, semiconductor orders, and cloud contracts are still growing at record pace. Nvidia’s order backlog is larger than its production capacity. AI capital expenditures in 2026 are projected to reach hundreds of billions of dollars globally.
The correction may be creating entry points in AI-exposed stocks. If the macro shock is temporary and oil prices stabilize, the structural AI growth story remains intact. However, if energy costs stay elevated and hit corporate capex budgets, even the AI trade is not immune.
💡 Practical Investor Checklist: What to Do Right Now
✔️ Actions Worth Taking
- Assess your cash reserves — know how much dry powder you have for a potential buying opportunity
- Review energy and defense exposure in your portfolio — these sectors are direct beneficiaries of elevated geopolitical risk
- Consider dollar-cost averaging (DCA) into quality positions — do not try to time the exact bottom
- Check tax-loss harvesting opportunities — sell losing positions to capture the tax benefit, then rotate into similar assets
- For long-term accounts like Roth IRA or 401(k), stay the course — short-term corrections are noise in a decades-long investment horizon
🚫 What Not to Do In a Correction
- Panic-selling your core holdings locks in losses permanently — the biggest crashes in history reverse right before most investors give up
- Avoid chasing leveraged ETFs to recoup losses quickly — volatility destroys leveraged positions in both directions
- Ignore crash predictions flooding social media — most are engagement bait, not serious financial analysis
- Stop checking your portfolio every hour — fear-driven decisions made at peak panic are almost always the wrong ones
🔭 The Two Scenarios Investors Need to Watch
🌅 The Bull Case: Diplomatic Breakthrough
If the US and Iran reach a ceasefire or diplomatic agreement, oil will drop fast. Markets love certainty. A sudden drop in oil toward $80 would slash inflation fears, kill the rate hike narrative, and likely trigger a sharp rebound in equities. Growth stocks would benefit the most.
Add strong Q1 earnings from Big Tech — especially if AI revenue continues to outperform expectations — and the market could recover most of Q1’s losses within weeks. This is the scenario bulls are waiting for.
🌧️ The Bear Case: War Drags On
If the conflict extends into summer, the Macquarie $200 oil scenario becomes plausible. Stagflation — rising prices alongside slowing growth — would force the Fed into an impossible position. Raising rates into a weakening economy could trigger a deeper recession. In that scenario, the S&P500 could fall another 10% to 20% from current levels.
Supply chain disruptions, a potential Strait of Hormuz closure, and broader global trade slowdowns would compound the damage. This is not a base case, but it is a tail risk that serious investors cannot ignore.
🔗 External Links
- WSJ Markets
- Yahoo Finance — S&P500
- CNBC Investing
- Federal Reserve — Monetary Policy
- Macrotrends — S&P500 Historical Returns